
Table of Contents
The Outcomes Benchmarking Dashboard provides a view of completion rates and other outcomes for students by cohort year as compared to benchmarking institutions.
The dashboard sorts student outcomes into three categories:
- Completed: The student has earned a credential (bachelor’s degree, associate’s degree, or certificate) at the cohort institution or another institution.
- Still Enrolled: The student is still enrolled at the cohort institution or another institution.
- Not Enrolled: The student has not earned a credential and is no longer enrolled at any institution.
You can view outcomes for up to eight cohort years and two to eight years after the students’ initial enrollment (each outcome year includes outcomes that occurred during prior years). By default, the dashboard considers outcomes for the last eight cohorts after two years. You can adjust these parameters using the global filters and the Outcomes At filter.
If a student has multiple outcomes in the selected time period, the dashboard shows the highest outcome for the student. It ranks student outcomes in the following order:
- Bachelor’s degree at your institution
- Bachelor’s degree at another institution
- Associate’s degree or certificate at your institution
- Associate’s degree or certificate at another institution
- Still enrolled at your institution
- Still enrolled at another institution
- Not enrolled
Dashboard Sections
Summary
The summary at the top of the dashboard states the completion rates of the cohort institution compared to the benchmarking institutions.
Click the number of benchmarking institutions to see a list of the institutions the dashboard is using for benchmarking.

Total Completed or Still Enrolled
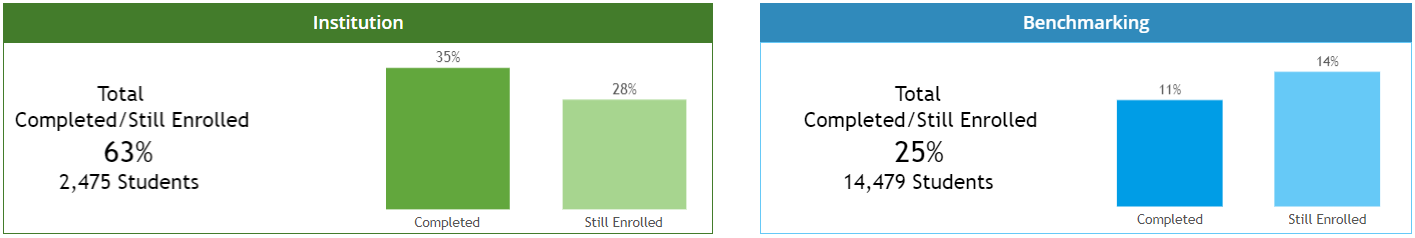
To view this section, you must select benchmarking data sources. See Benchmarking Data Sources for details.
This section shows the number and percentage of students categorized as either “Completed” or “Still Enrolled” at the cohort institution and benchmarking institutions. The green box contains data for the cohort institution; the blue box contains data for the benchmarking institutions.
Total Completed/Still Enrolled Year-Over-Year by Dimension
This section shows the percentages of students categorized as “Completed” or “Still Enrolled” at the cohort institution and benchmarking institutions year-over-year by dimension.
The cohort institution is represented by a green line, and the benchmarking institutions are represented by a blue line. Once you select a dimension, you can select a category of students to view more detailed information in the Outcomes by Dimension for Category section of the dashboard.
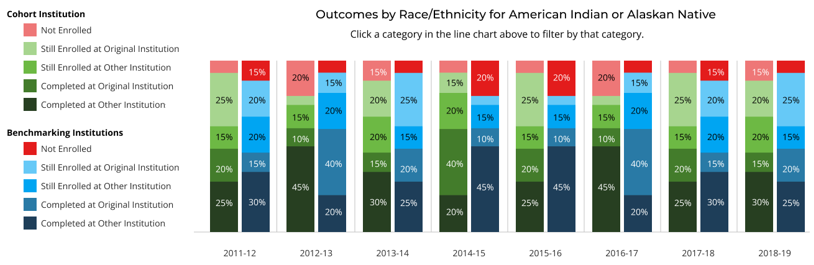
Outcomes by Dimension for Category
This section shows student outcomes at the cohort institution and benchmarking institutions year-over-year by the selected dimension for the selected category. In this section, “original institution” refers to the institution in which a student originally enrolled, whether it’s the cohort institution or another institution, and “other institution” refers to an institution other than the original institution, whether it’s the cohort institution or another institution.
The outcomes categories are broken down into more detail as follows:
| Category | Description | Example |
| Not Enrolled | The student has not earned a credential and is not currently enrolled at any institution. | Troy enrolled at Greendale University in 2019. He withdrew from Greendale University in 2020 before completing his bachelor’s degree and is not currently enrolled at any institution. |
| Still Enrolled at Original Institution | The student is still enrolled at the institution at which they originally enrolled. | Jeff enrolled at Greendale University in 2019. He is still enrolled at Greendale University and has not yet completed his bachelor’s degree. |
| Still Enrolled at Other Institution | The student is still enrolled at an institution other than the one at which they originally enrolled. | Pierce enrolled at Greendale University in 2019. He transferred to Grand Lakes University in 2020 and is still enrolled at Grand Lakes University, where he is working on completing his bachelor’s degree. |
| Completed at Original Institution | The student has earned a credential at the institution at which they originally enrolled. | Annie enrolled at Greendale University in 2017. She earned her bachelor’s degree from Greendale University in 2021 and is no longer enrolled at any institution. |
| Completed at Other Institution | The student has earned a credential at an institution other than the one at which they originally enrolled. | Shirley enrolled in Greendale University in 2017. She transferred to Grand Lakes University in 2018, where she earned her bachelor’s degree in 2021. She is no longer enrolled at any institution. |
For each year, the cohort institution data is shown on the left in shades of green, and the benchmarking data is shown on the right in shades of blue. The different shades of green and blue represent the different “Still Enrolled” and “Completed” outcome categories. The red shades represent the “Not Enrolled” category.
Global Filters
You can use the global filters to select the cohort and refine the students the dashboard includes. Global filters apply to the entire dashboard.
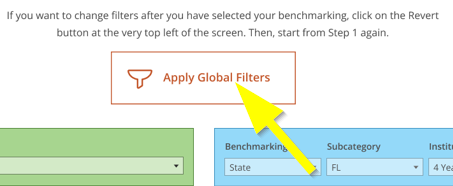
The global filter options are hidden by default. Click Apply Global Filters to view them. Click the X to re-hide them.

Outcomes At
This dashboard includes a unique filter called Outcomes At. You can use this filter to select the time period (number of years after the students’ initial enrollment) the dashboard includes. This filter applies to the entire dashboard.
Benchmarking Data Sources
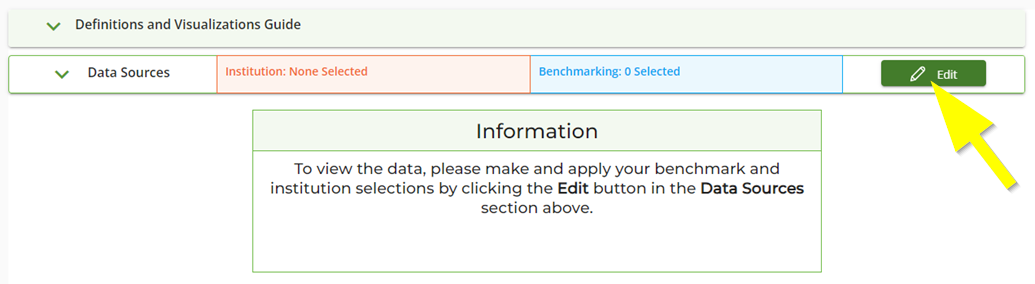
You can use this section to refine the list of institutions the dashboard uses for benchmarking. These selections apply to the entire dashboard. When you first open the dashboard, you must select benchmarking data sources in order for the data to show.
If you would like to apply both global filters and benchmarking filters, select the benchmarking data sources first, then apply the global filters.
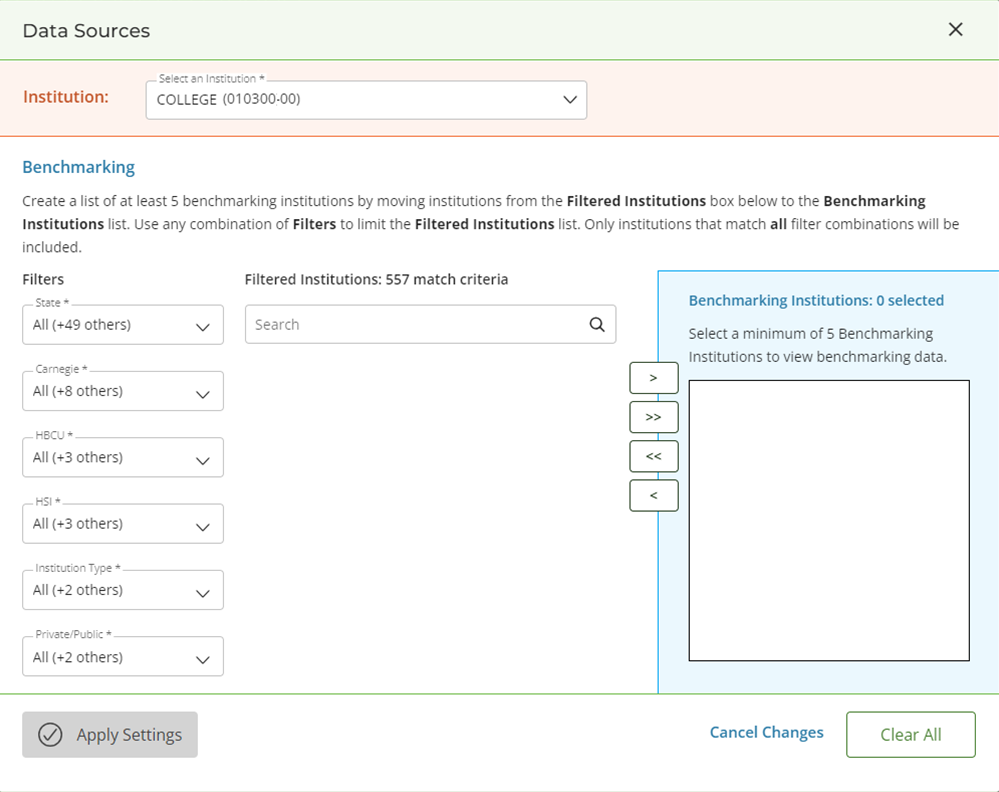
- Click Edit on the Data Sources menu.
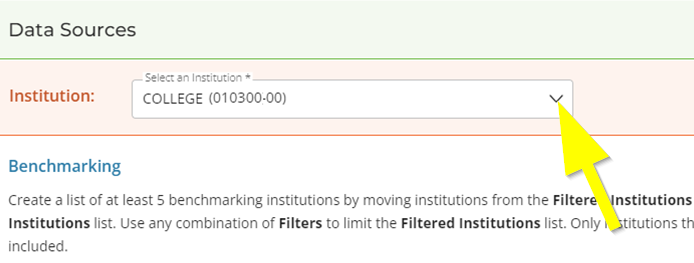
- If your account is part of a system of institutions or a third party organization, select a cohort institution from the Institution drop-down.
- Select your benchmarking institutions from the PDP participating institutions by filtering and/or searching. See below for details.
You can use filtering in combination with searching. For example, if you find a few institutions by searching and want to add more with similar institutional characteristics, you can use filters to find and select them.
- To add a single institution to your benchmarking institutions list, click the Add
 button. To add all of the filtered institutions to your list, click the Add All
  button.
 - To remove a single institution from your benchmarking institutions list, click the Remove
 button. To remove all institutions from your list, click the Remove All
  button.
 - When finished, click Apply Settings.
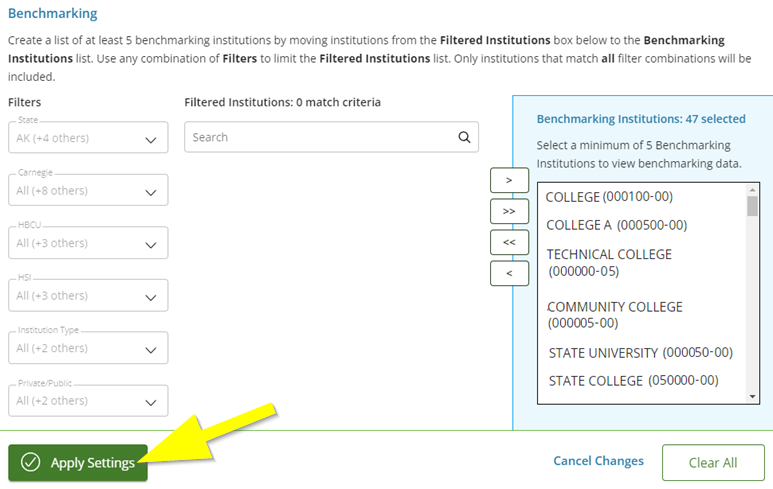
You must select five benchmarking institutions in order to save your selections. If you have selected less than five institutions, the Apply Settings button will be disabled and you will not be able to save your selections.
Searching for Benchmarking Institutions
You can search for an institution by name or OPEID.
- Click in the Search box. If you have not applied any filters, you will see a list of all available PDP participating institutions.
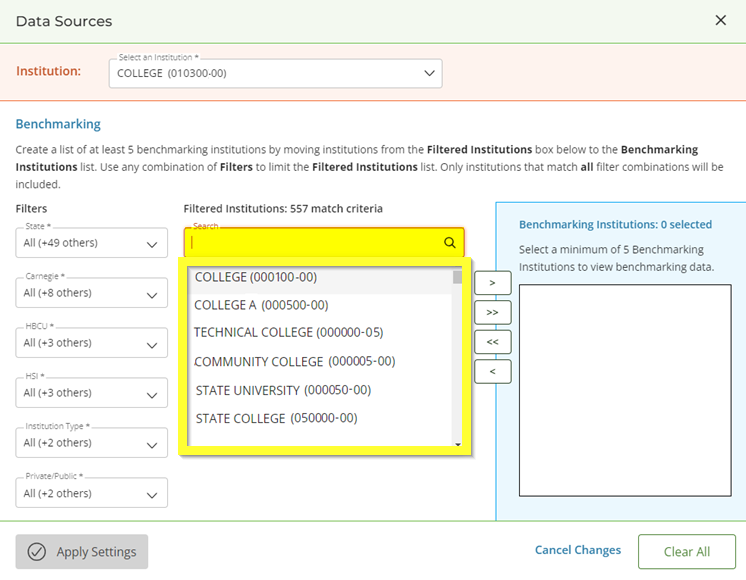
- Start typing an institution name or OPEID to narrow down the list.
- Select the institution(s) you would like to add to your benchmarking institutions list.
Filtering Benchmarking Institutions
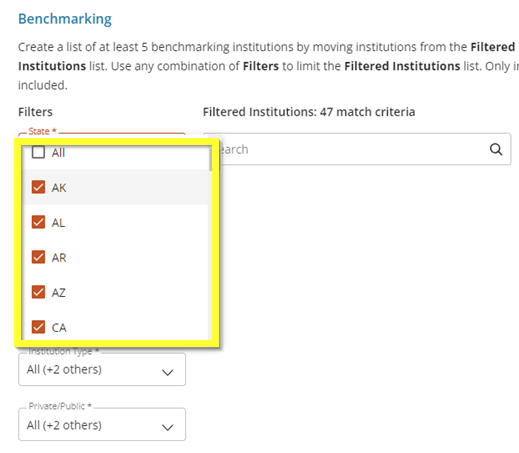
You can use the benchmarking filters to select institution(s) that meet certain criteria by selecting or deselecting values from Filters menu. The filters will be applied to the list of filtered institutions as you select them.
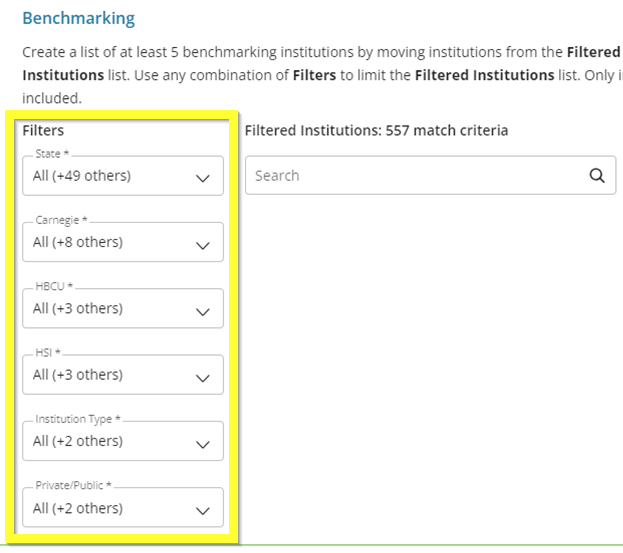
Filter Options
- State: State in which the institution(s) are located
- Carnegie: Institution(s) classified by the Carnegie Classification system – rolled up
- HBCU: Historically black colleges and universities
- HSI: Hispanic-serving institutions
- Institution Type: 4-Year, 2-Year, or All
- Public/Private: Public, Private, or All
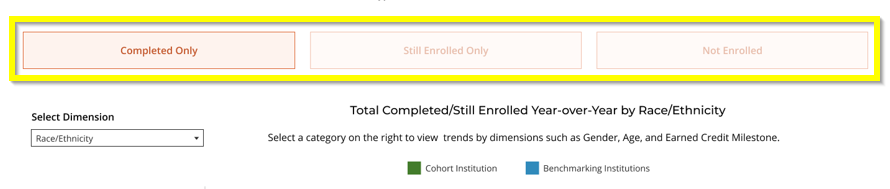
Student Outcome Buttons
You can use the student outcome buttons to filter the data in the Total Completed/Still Enrolled Year-Over-Year by Dimension line graph by student outcome: Completed Only, Still Enrolled Only, or Not Enrolled. The student outcome buttons only apply to the Total Completed/Still Enrolled Year-Over-Year by Dimension section of the dashboard.
Dimensions
Select a dimension from the Select Dimension drop-down to filter the data in the Total Completed/Still Enrolled Year-Over-Year by Dimension line graph by student group: Race/Ethnicity, Gender, Age, GPA Range, or Credential Type Sought. Dimensions only apply to the Total Completed/Still Enrolled Year-Over-Year by Dimension section of the dashboard.
Categories
Click a category on the left side of the Total Completed/Still Enrolled Year-Over-Year by Dimension line graph to filter the Outcomes by Dimension for Category bar graph by student category. Categories only apply to the Outcomes by Dimension for Category section of the dashboard.
Example
If you select the Race/Ethnicity dimension and the American Indian or Alaskan Native category from the Total Completed/Still Enrolled Year-Over-Year by Dimension section, the Outcomes by Dimension for Category bar graph will display outcomes data only for American Indian or Alaskan Native students.

Troubleshooting No Data
There are two reasons why the Outcomes Benchmarking Dashboard might show no data:
- Not Enough Benchmarking Institutions: The dashboard requires at least five benchmarking institutions to show benchmarking data. You may have filtered the benchmarking institutions down to less than five. Remove one or more benchmarking filters.
- Not Enough Cohort Students: The dashboard requires at least 11 students to show student outcomes data. You may have filtered the students in the selected cohorts down to less than 11. Remove one or more global filters.
