
Table of Contents
The First Year Credit Accumulation Rate Benchmarking Dashboard provides a view of how successful students are at completing enough credits in their first academic year of enrollment to progress toward on-time completion as compared to benchmarking institutions. It can help institutions determine whether students are gaining academic momentum early on so they can plan interventions to help students succeed.
Students Included
The dashboard only includes first year and transfer-in students who have attempted at least one credit in their first academic year. It does not included students who have not attempted any credits in their first academic year. The dashboard calculates each student’s first year individually, not according to the institution’s academic year, and it includes summer and intersession terms.
The dashboard only includes students with an attendance status of either full-time or part-time. It does not include students with an attendance status of “Unknown.” The Clearinghouse determines if a student is full-time or part-time based on the total number of credits the student attempted during their first term. We collect information from institutions each academic term to determine the number of credits required for full-time vs. part-time.
Credit Accumulation Threshold
The default credit accumulation threshold is 15 per year for part-time students and 30 per year for full-time students. You can adjust the threshold to 12 for part-time students and 24 for full-time students using the credit threshold buttons.
Credit Accumulation Rate
The dashboard calculates an institution’s credit accumulation rate as the total number of students who met their credit accumulation threshold in their first academic year divided by the total number of students, not including students with an attendance status of “Unknown.”
Dashboard Sections
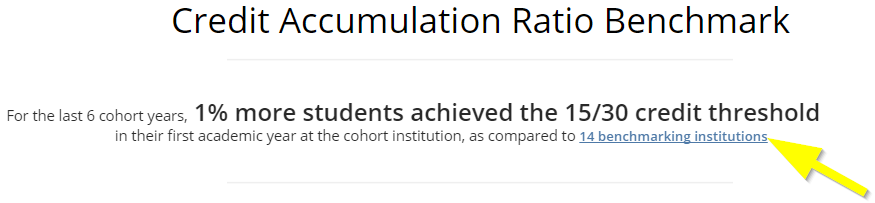
Summary
The summary at the top of the dashboard states the percentage of students who met their credit accumulation threshold in their first academic year at the cohort institution compared to the benchmarking institutions.
Click the number of benchmarking institutions to see a list of the institutions the dashboard is using for benchmarking.
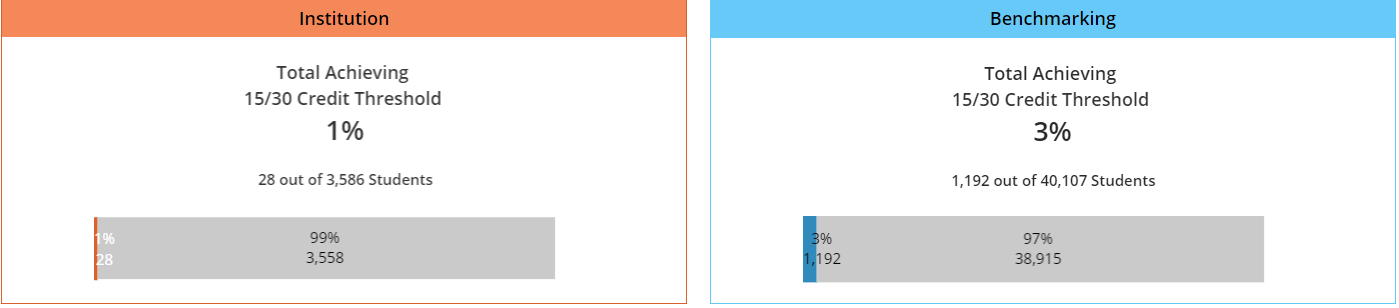
Total Achieving Credit Threshold
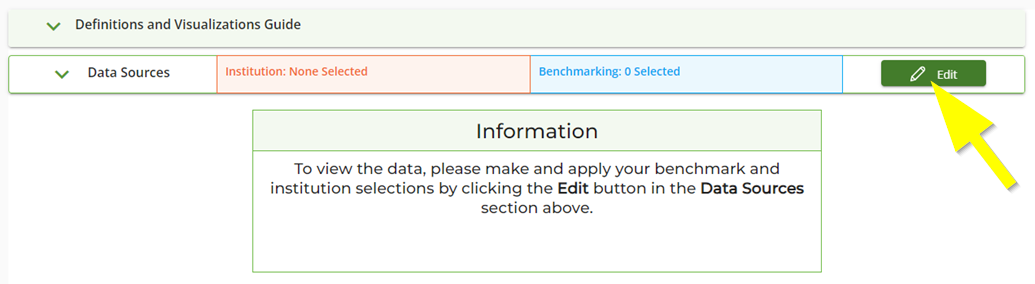
To view this section, you must select benchmarking data sources. See Benchmarking Data Sources for details.
This section shows the number and percentage of students who have met their credit accumulation threshold in their first academic year at the cohort institution and benchmarking institutions. The orange box contains data for the cohort institution; the blue box contains data for the benchmarking institutions.
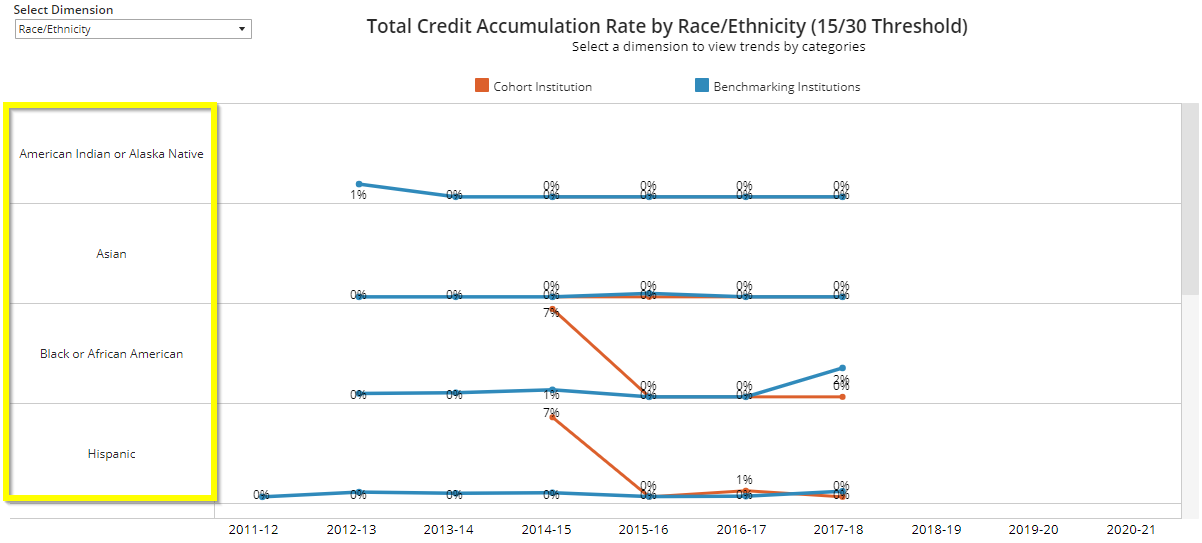
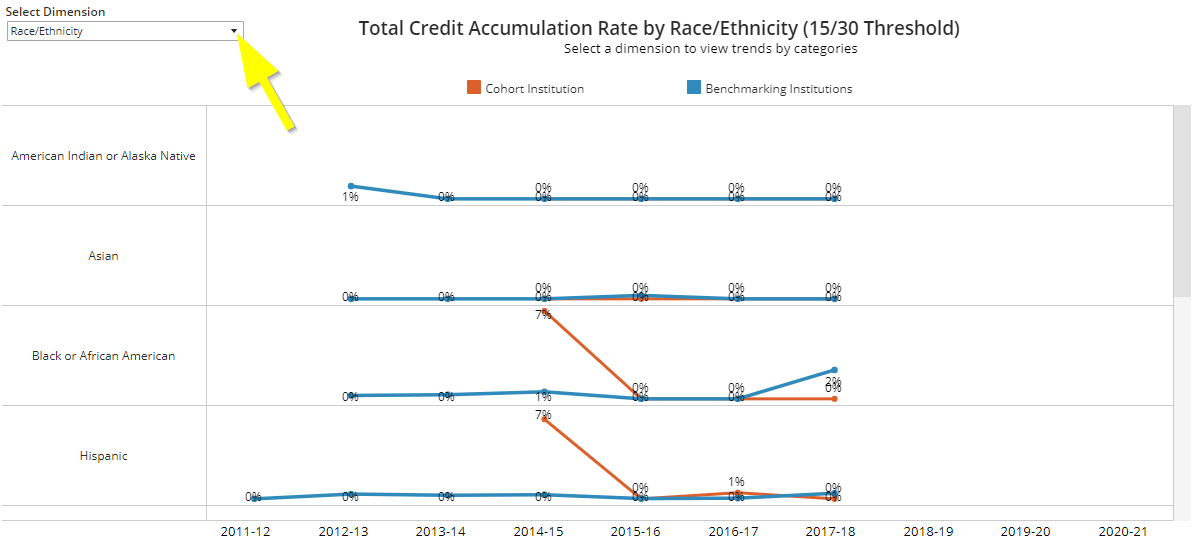
Total Credit Accumulation Rate by Dimension
This section shows the credit accumulation rate of the cohort institution and benchmarking institutions by dimension.
The cohort institution is represented by an orange line, and the benchmarking institutions are represented by a blue line. Once you select a dimension, you can click a category to view more detailed information in the Credit Accumulation Rate by Dimension for Category section of the dashboard.
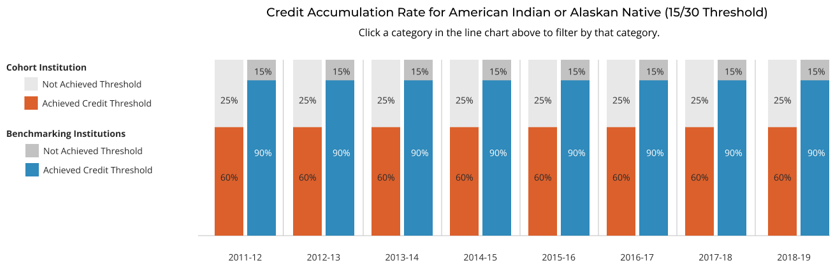
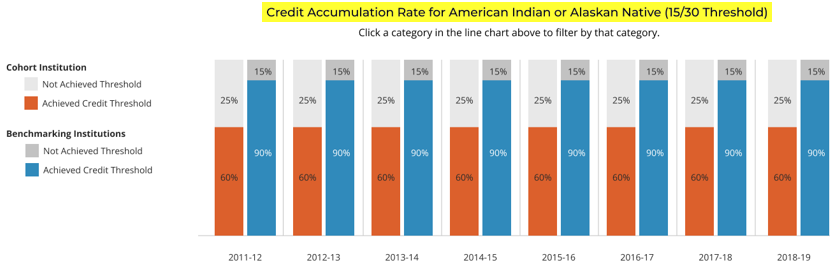
Credit Accumulation Rate by Dimension for Category
This section shows the credit accumulation rate for the cohort institution and benchmarking institutions by the selected dimension for the selected category.
For each year, the cohort institution data is shown on the left in orange, and the benchmarking data is shown on the right in blue.
Global Filters
You can use the global filters to select the cohort and refine the students the dashboard includes. Global filters apply to the entire dashboard.
The global filter options are hidden by default. Click Apply Global Filters to view them. Click the X to re-hide them.


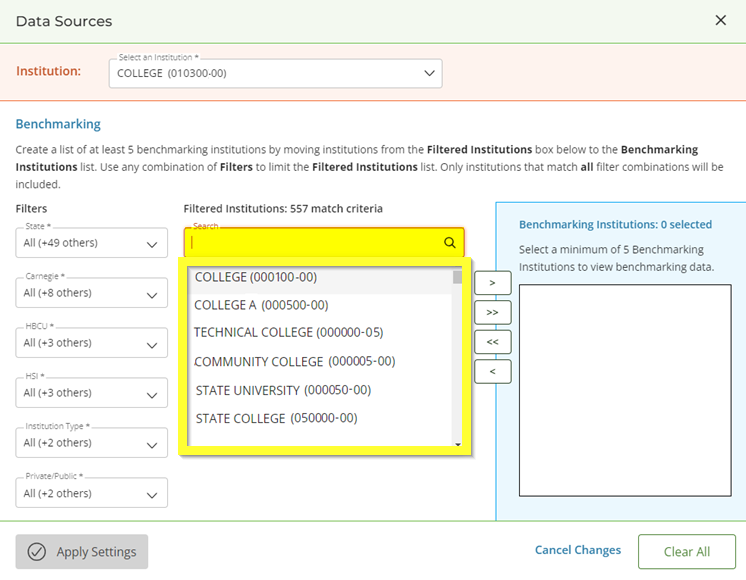
Benchmarking Data Sources
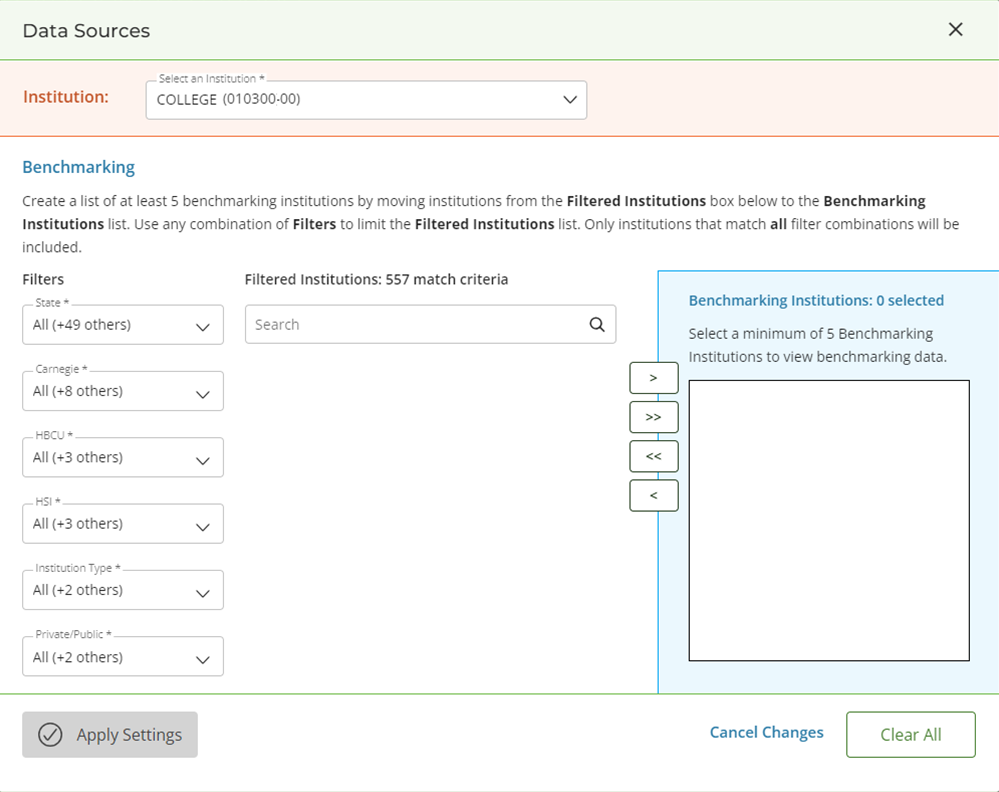
You can use this section to refine the list of institutions the dashboard uses for benchmarking. These selections apply to the entire dashboard. When you first open the dashboard, you must select benchmarking data sources in order for the data to show.
If you would like to apply both global filters and benchmarking filters, select the benchmarking data sources first, then apply the global filters.
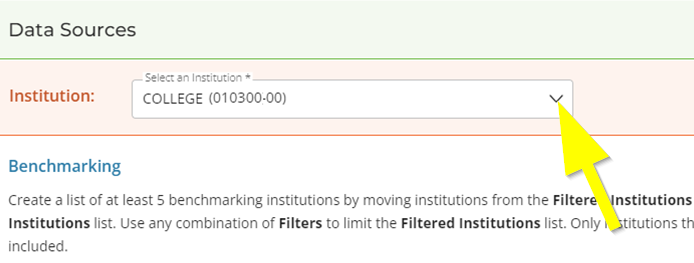
- Click Edit on the Data Sources menu.
- If your account is part of a system of institutions or a third party organization, select a cohort institution from the Institution drop-down.
- Select your benchmarking institutions from the PDP participating institutions by filtering and/or searching. See below for details.
You can use filtering in combination with searching. For example, if you find a few institutions by searching and want to add more with similar institutional characteristics, you can use filters to find and select them.
- To add a single institution to your benchmarking institutions list, click the Add
 button. To add all of the filtered institutions to your list, click the Add All
  button.
 - To remove a single institution from your benchmarking institutions list, click the Remove
 button. To remove all institutions from your list, click the Remove All
  button.
 - When finished, click Apply Settings.
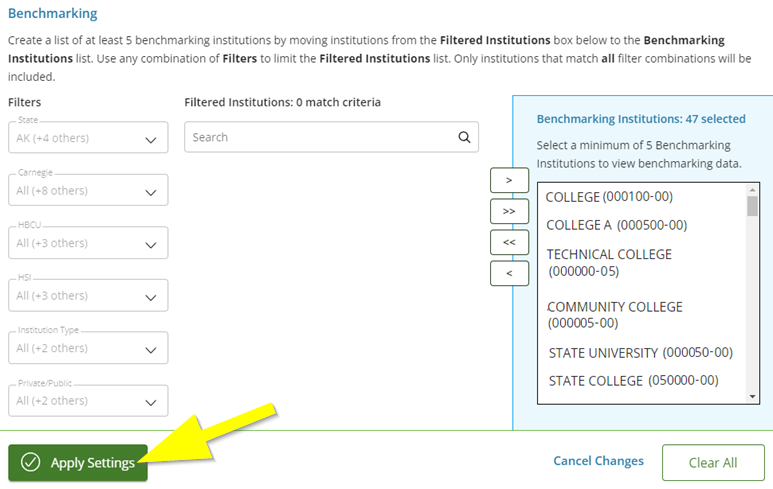
You must select five benchmarking institutions in order to save your selections. If you have selected less than five institutions, the Apply Settings button will be disabled and you will not be able to save your selections.
Searching for Benchmarking Institutions
You can search for an institution by name or OPEID.
- Click in the Search box. If you have not applied any filters, you will see a list of all available PDP participating institutions.
- Start typing an institution name or OPEID to narrow down the list.
- Select the institution(s) you would like to add to your benchmarking institutions list.
Filtering Benchmarking Institutions
You can use the benchmarking filters to select institution(s) that meet certain criteria by selecting or deselecting values from Filters menu. The filters will be applied to the list of filtered institutions as you select them.
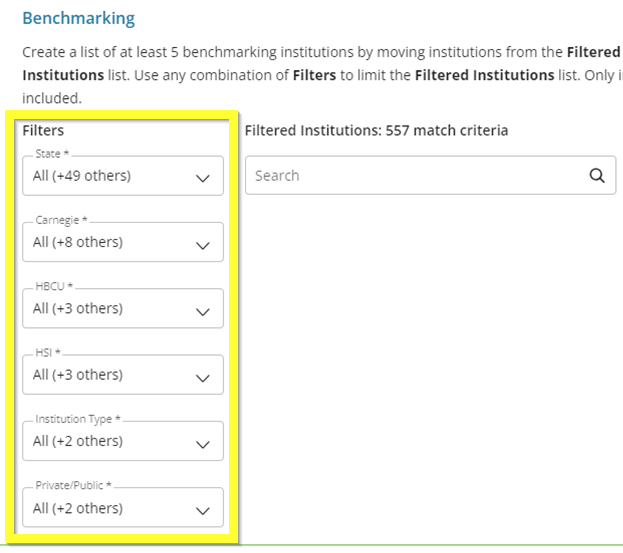
Filter Options
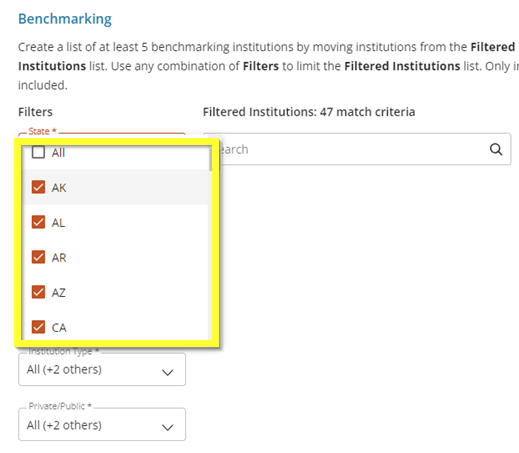
- State: State in which the institution(s) are located
- Carnegie: Institution(s) classified by the Carnegie Classification system – rolled up
- HBCU: Historically black colleges and universities
- HSI: Hispanic-serving institutions
- Institution Type: 4-Year, 2-Year, or All
- Public/Private: Public, Private, or All
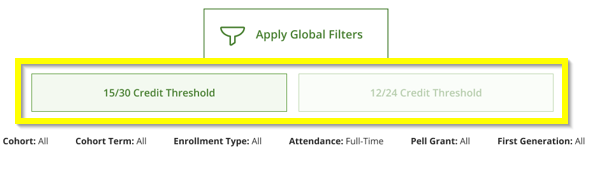
Credit Threshold Buttons
You can use the credit threshold buttons to filter the data in the Total Credit Accumulation Rate by Dimension line graph by credit accumulation threshold: 15/30 Credit Threshold or 12/24 Credit Threshold. The credit threshold buttons apply to the entire dashboard.
Dimensions
Select a dimension from the Select Dimension drop-down to filter the data in the Total Credit Accumulation Rate by Dimension line graph by student group: Overall, Race/Ethnicity, Gender, Age Group, GPA Range, or Credential Type Sought. Dimensions only apply to the Total Credit Accumulation Rate by Dimension section of the dashboard.
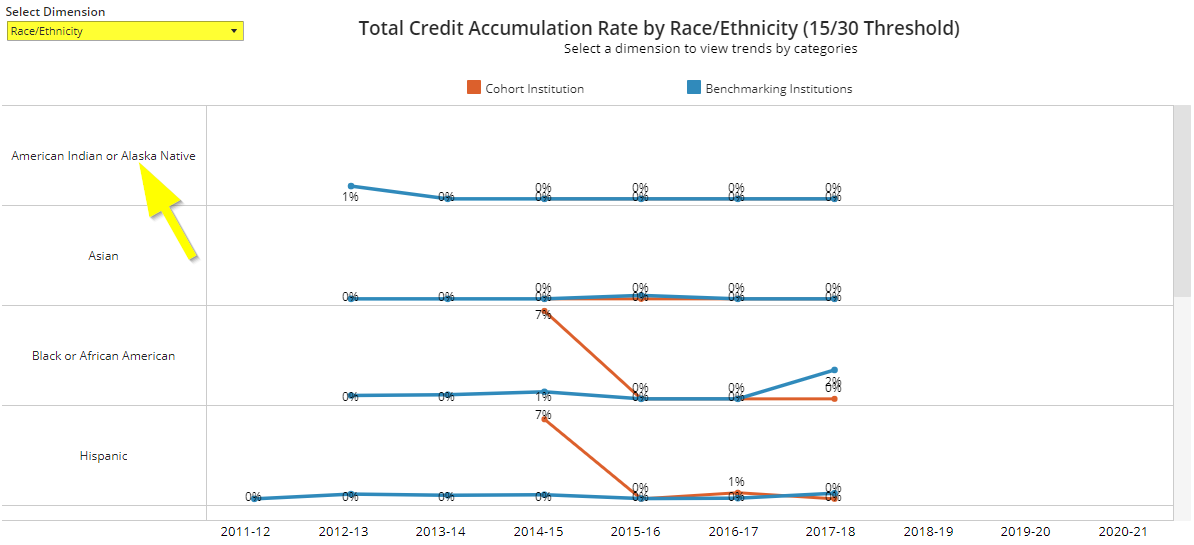
Categories
Click a category on the left side of the Total Credit Accumulation Rate by Dimension line graph to filter the Credit Accumulation Rate by Dimension for Category bar graph by category. Categories only apply to the Credit Accumulation Rate by Dimension for Category section of the dashboard.
Example
If you select the Race/Ethnicity dimension and the American Indian or Alaskan Native category from the Total Credit Accumulation Rate by Dimension section, the Credit Accumulation Rate by Dimension for Category bar graph will display credit accumulation data only for American Indian or Alaskan Native students.
Troubleshooting No Data
There are two reasons why the Credit Accumulation Rate Benchmarking Dashboard might show no data:
- Not Enough Benchmarking Institutions: The dashboard requires at least five benchmarking institutions to show benchmarking data. You may have filtered the benchmarking institutions down to less than five. Remove one or more benchmarking filters.
- Not Enough Cohort Students: The dashboard requires at least 11 students to show student outcomes data. You may have filtered the students in the selected cohorts down to less than 11. Remove one or more global filters.
