
Table of Contents
After your institution has certified your data submission and it passes all data quality checks, the Clearinghouse processes and aggregates the data and provides you with access to analysis-ready files and institution- and benchmarking-level dashboards. Even with data quality checks and audits we apply during the submission and aggregation process, it is possible that inaccurate, missing, unknown, or otherwise incomplete data or values may be included in the dashboards. Errors or delays in submitting data to other Clearinghouse services, such as enrollment reporting or degree verification, can also impact the quality of the PDP dashboards. For more detailed information on the impact of missing data, see Key Performance Indicators and Critical Data Elements.
This Data Quality Dashboard Check from achievingthedream.org ![]() can help you determine if all the data your institution submitted is visible and the dashboards and filters are functioning correctly. If the the numbers or calculations look incorrect (e.g., credit completion ratio is 100%), there is a high number of “unknowns” for a variable, or a filter or dashboard is not populated, contact Clearinghouse representative at pdpservice@studentclearinghouse.org to discuss and resolve the issue(s) before rolling out the dashboards at your institution.
can help you determine if all the data your institution submitted is visible and the dashboards and filters are functioning correctly. If the the numbers or calculations look incorrect (e.g., credit completion ratio is 100%), there is a high number of “unknowns” for a variable, or a filter or dashboard is not populated, contact Clearinghouse representative at pdpservice@studentclearinghouse.org to discuss and resolve the issue(s) before rolling out the dashboards at your institution.
Tutorials
To familiarize yourself with the dashboards, watch the following tutorial videos:
Basic Institution-Level Dashboard Functionality
Dimensions and Filters
When checking data consistency in the PDP dashboards, you should start with the dashboards where you have submitted data on all semesters for a cohort year. For this check, we will review the First Year Enrollment, First Year Gateway Course Completion, First Year Credit Accumulation Rate, and First Year Credit Completion Ratio dashboards.
As you work through each step, document any discrepancies with your data and note the cohort year(s) and filter(s) you selected to inform your discussion with the Clearinghouse representative.
First Year Enrollment Dashboard
Check 1: Cohort Enrollment
Review Cohort Enrollment section at the top of the dashboard, focusing on the most recent cohort year for which you have submitted a full year of data. If any of the three boxes are blank, this is an indication that your data needs further review.
![]()
If you have not yet submitted data for ANY semester in the most recent cohort year, select the next most recent cohort year from the Cohort filter in the top left.
Determine if the cohort size is what you expected. If the number looks significantly different from your average undergraduate cohort size for a year, you might have incomplete or missing cohort or course data.
Check 2: Filters
Review each of the filters at the top of the dashboard to ensure that all submitted data is populated. This is crucial for your institution to be able to disaggregate the data in the future.
Each time you select or deselect a filter, you must click Apply for the filter to take effect.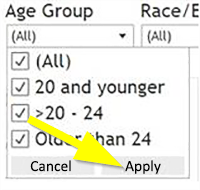
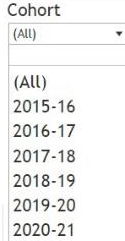
- Cohort: Click each year and check the Cohort Enrollment section at the top of the dashboard. The numbers should change with each year you select. If the numbers seem incorrect, this is another indication that your data requires further review. If the most recent year’s data is not complete, choose the next most recent year for the following steps.
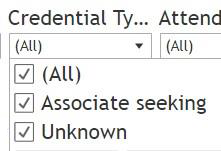
Cohort Term: Select each option and make sure numbers are showing for every term. Make sure the semesters and sessions are correct for your institution. Examples of incorrect semesters/sessions would be if winter is showing but your institution does not offer a winter session or if your institution offers a summer semester but summer isn’t showing. - Credential Type Sought: Ensure that all types of credentials are showing. Often only one degree type appears. In the example below, only Associate and Unknown are showing. Select Unknown. Does this number seem too high for all cohort years? If so, look at the individual cohort year to assess further (select All to uncheck all options, then select the year and click Apply). It’s possible that for some years you did not correctly identify the students’ degree type sought in your course file(s), or a course file is missing. Select All again ensure all students are populated before continuing to the next filter.
- Attendance: The options for this filter are Full-time, Part time, and Unknown. Select Unknown. Does the number look correct? Select both Full-time and Part-time. Does this number look correct? If many students are Unknown for attendance, a course file might be missing or incomplete for that cohort.
- Dual/Summer Enrollment: This is an optional field, so Unknown may be the only option available. Make sure the numbers are populated, then check the numbers by a specific cohort year for which you have submitted all the data.
These students are only the ones with dual enrollment who matriculated, so if you do not know this number, skip this section for now.
- Age Group: Since the age group is calculated, you do not need to select any options for this filter.
- Race/Ethnicity: Select either your institution’s highest or lowest race/ethnicity populations and look at them individually. The Clearinghouse uses small cell suppression, so this method might not work depending on your institution’s numbers. Each student can only be counted in one category on the dashboard, so you might see slight variations from your internal numbers if you do not de-duplicate.
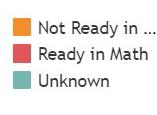
- Pell Grant, First Generation, Math Prep, and English Prep: You should see each category as an option as well as All and Unknown. Select each option and make sure numbers appear. For example, Math Prep should show Ready in Math and Not Ready in Math. First Generation, Math Prep, and English Prep are optional fields, so you will only see Unknown if you did not provide this information.
First Year Gateway Course Completion Dashboard
Submitting gateway course data is option, but we highly recommend it. If this dashboard is not populated, it is likely because your institution did not submit this data.
Check 1: Required vs. Cohort
Compare the number for required gateway math and English to the overall new student cohort. If the numbers are roughly equal, your institution might have coded all new students as requiring gateway math and English instead of considering the requirement at the program-level.
Check 2: Unknown Statuses
Select Math Prep and English Prep from the Select Dimension drop-down. In the top-right quadrant, you should see two to three line graphs, depending on whether you have Unknown showing in the legend.
Select GPA Range from the Select Dimension drop-down. If there is a substantial number of students with UK GPAs in the bottom-left quadrant, or data is missing for multiple years, your data requires further review.
First Year Credit Accumulation Rate Dashboard
Check 1: CAR Drops
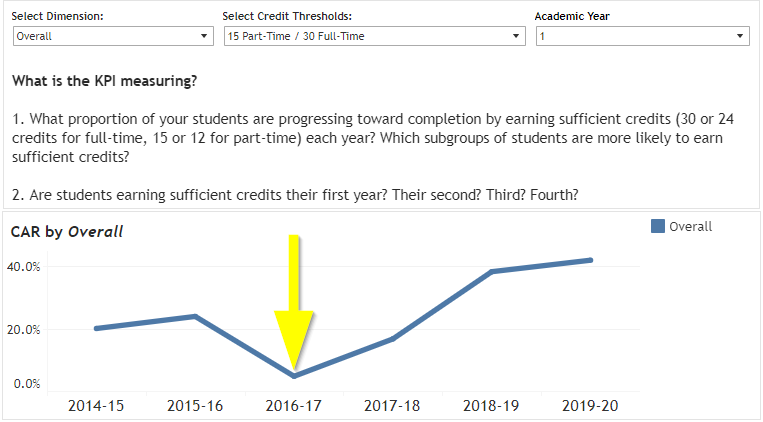
Determine if you there are any drops in the credit accumulation rate (CAR) percentage for older cohorts. The most recent cohort might show a small drop as compared to previous cohorts if you have not submitted all course data for that cohort’s first academic year.
In the example below, there is a drop to nearly 0% in the 2016-17 cohort. This could indicate that course data is missing for the 2016-17 cohort for their first academic year (possibly one or more terms).
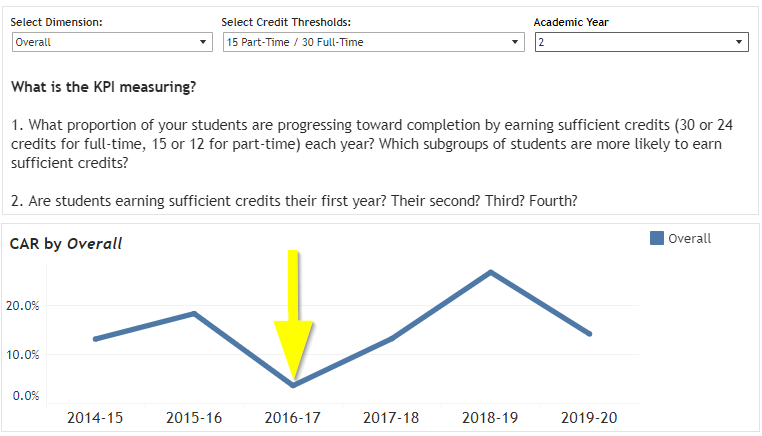
Select 2 from the Academic Year filter. Again, the most recent cohort might show a small drop as compared to previous cohorts if you have not submitted all course data for that cohort’s second academic year.
In the example below, there is a drop to nearly 0% in the 2016-17 cohort. This could indicate that course data is missing for the 2016-17 cohort for their second academic year (possibly one or more terms).
Check 2: CAR Spikes
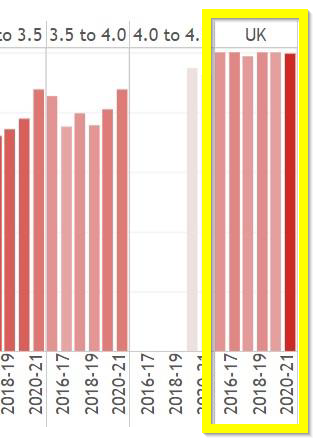
Select both 1 and 2 from the Academic Year filter. Look for any spikes in CAR. Most institutions see CAR at somewhere between 30-50%. If you see numbers closer to 90-100% for a cohort, there might be issues with your course data.
First Year Credit Completion Ratio Dashboard
Check 1: Credit Completion Ratios
Review the credit completion ratio numbers on the dashboard. If they seem very low or very high, there might be issues with your course data and/or how you coded credits earned/attempted for courses.
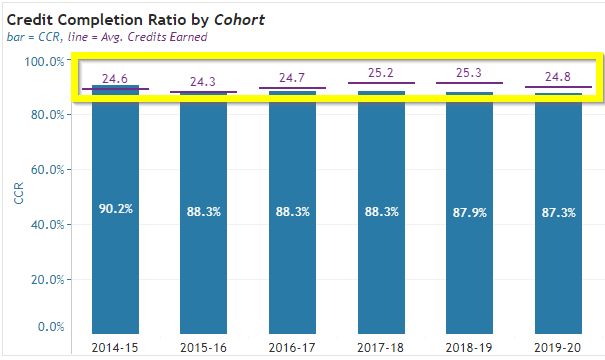
Check 2: Average Credits Earned
Look at the Credit Completion Ratio by Cohort section of the dashboard. If you see purple lines that are very low (close to 0) or very high (over 30), there might be issues with your course data and/or how you coded credits earned/attempted for courses.
Next Steps
If you identify data quality issues based on this check, contact us at pdpservice@studeniclearinghouse.org, share your documentation, and schedule a time to discuss the discrepancies and how to resolve them.
If you did not identify any discrepancies, congratulations! You are now ready to share and use your dashboards.
