
Table of Contents
The Financial Aid dashboard provides a view of the distribution of financial aid at your institution with a focus on the amount of unmet need within a given cohort and academic year. The information on this dashboard enables you to track financial aid distribution trends by student characteristics across six cohort years and up to six academic years, providing a view of your institution’s distribution of aid, including grants, and any funding gaps (unmet need) that might exist within the specific groups.
Unmet need is calculated as: Cost of Attendance – (Grant Aid + EFC)
- Cost of Attendance: Includes tuition, books, room and board, and other expenses.
- Grant Aid: Includes need-based and non-need-based grants across the federal, state, and institution levels.
- EFC: The student’s expected family contribution.
Students Included
Only undergraduate students who enrolled for the first time at the institution, either as transfer-ins or first-time in college, are included in this dashboard.
Dashboard Sections
Summary
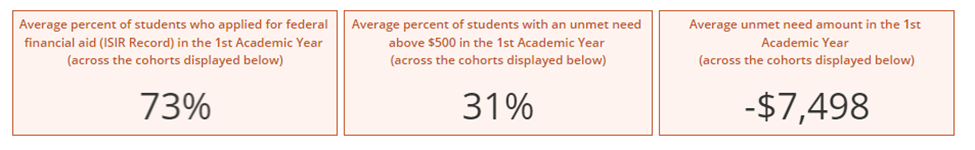
The three boxes along the top of the dashboard display average percentages across up to six cohorts for the selected academic year.
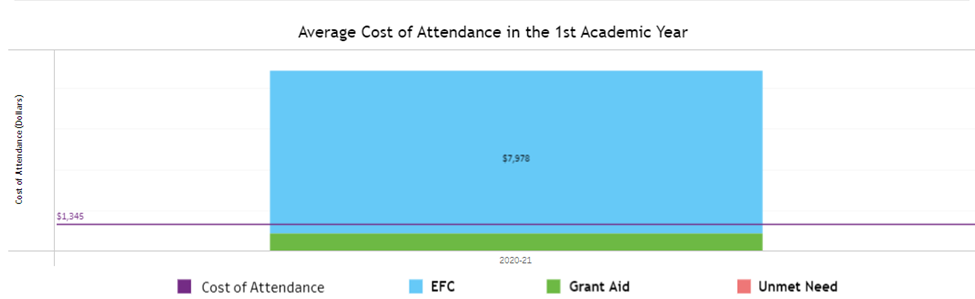
Average Cost of Attendance
This section provides a high-level overview of how your institution’s average cost of attendance, including average grant aid, EFC, and unmet need, has changed from one cohort to the next for the selected academic year.
The height of each bar reflects the the total cost of attendance. If grant aid + EFC greater than or equal to the cost of attendance, the average unmet need will not appear in the bar, and the average cost of attendance will appear lower on the graph.
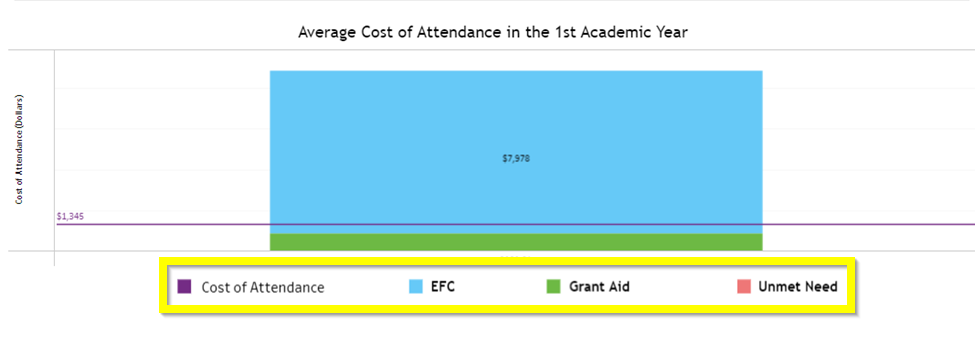
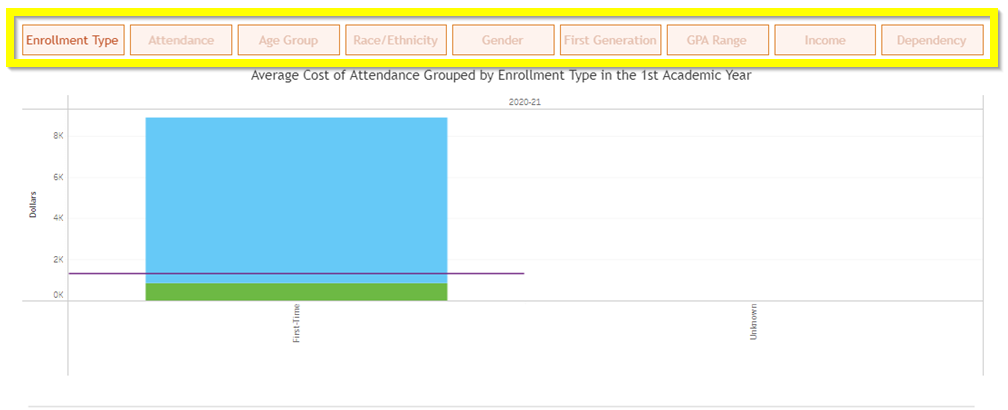
Breakdown by Type & Subgroup
This section allows you to break down the data by either grant aid, EFC, unmet need, or cost of attendance and filter it by a subgroup, such as enrollment type or race/ethnicity, in the selected academic year.
Select a type from the legend in the Average Cost of Attendance section.
Select a subgroup from the options along the top of the graph.
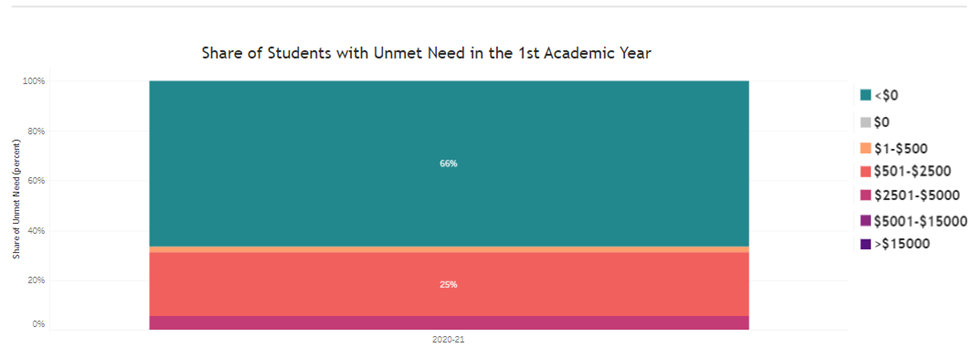
Share of Students with Unmet Need
This section provides an overview of whether the percentage of students with a certain range(s) of unmet need has changed from one cohort to the next for the selected academic year. This allows the you to see whether students have moved between unmet need ranges across cohorts, and for a single cohort, what percentage of students fell within certain ranges of unmet need.
For example, you can determine what percentage of students for a given cohort had between $1 and $500 of unmet need and compare this percentage with up to six cohorts.
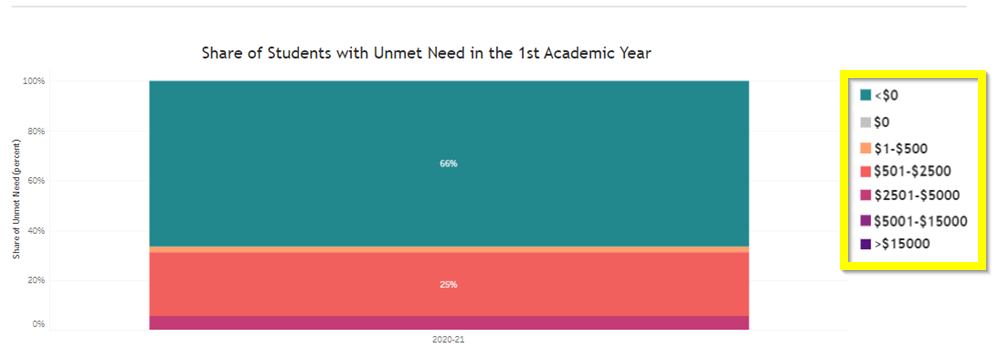
Breakdown by Range & Subgroup
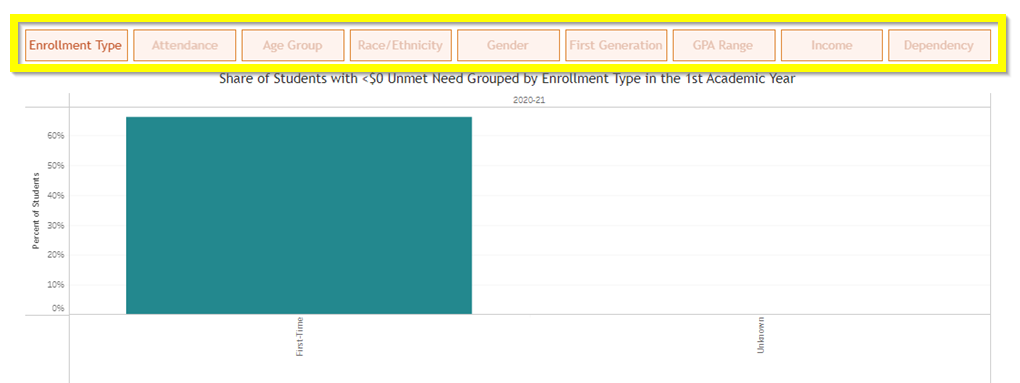
This section allows you to break down the share of students with unmet need by a specific range and filter it by subgroup.
Select a range from the legend in the Share of Students with Unmet Need section.
Select a subgroup from the options along the top of the graph.
Dashboard Filters
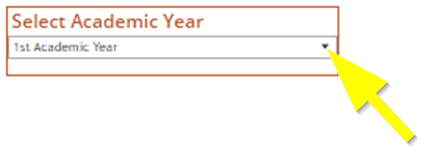
Academic Year
Select an academic year from the Select Academic Year drop-down. This filter applies to the entire dashboard.
Additional Filters
You can add additional filters that apply to the entire dashboard. The additional filter options are hidden by default. To view the filters, click Apply Additional Filters.
Click the X to re-hide the filters.
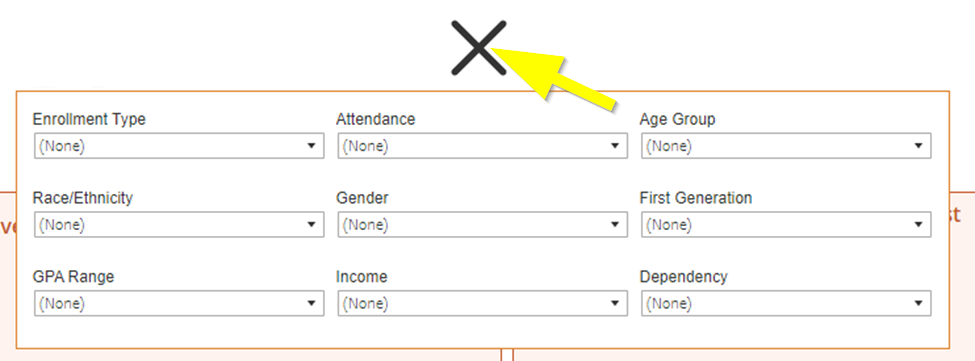
Filtered values will only appear if there is source data for the student subgroup you select. There is no limit to how many filters you can select at once; however, data might be suppressed if the student count becomes too low. See Troubleshooting No Data below for more information.
Troubleshooting No Data
There are three reasons why the Financial Aid Dashboard might show no data:
- Low Cell Size Suppression: Low cell size suppression or missing and/or incomplete data can cause graph to display zero percent or missing data points. Remove one or more filters.
- Not Enough Cohort Students: The dashboard requires at least 11 students to show student outcomes data. You may have filtered the students in the selected cohorts down to less than 11. Remove one or more filters.
